Threat Intelligence Triage
Security teams face an impossible volume of alerts. Traditional tools apply rigid rules that either miss subtle threats or drown analysts in false positives. This solution shows how to build a triage system that learns from your team’s expertise—automatically improving its judgment over time.
The Problem
Section titled “The Problem”Every security team knows these failure modes:
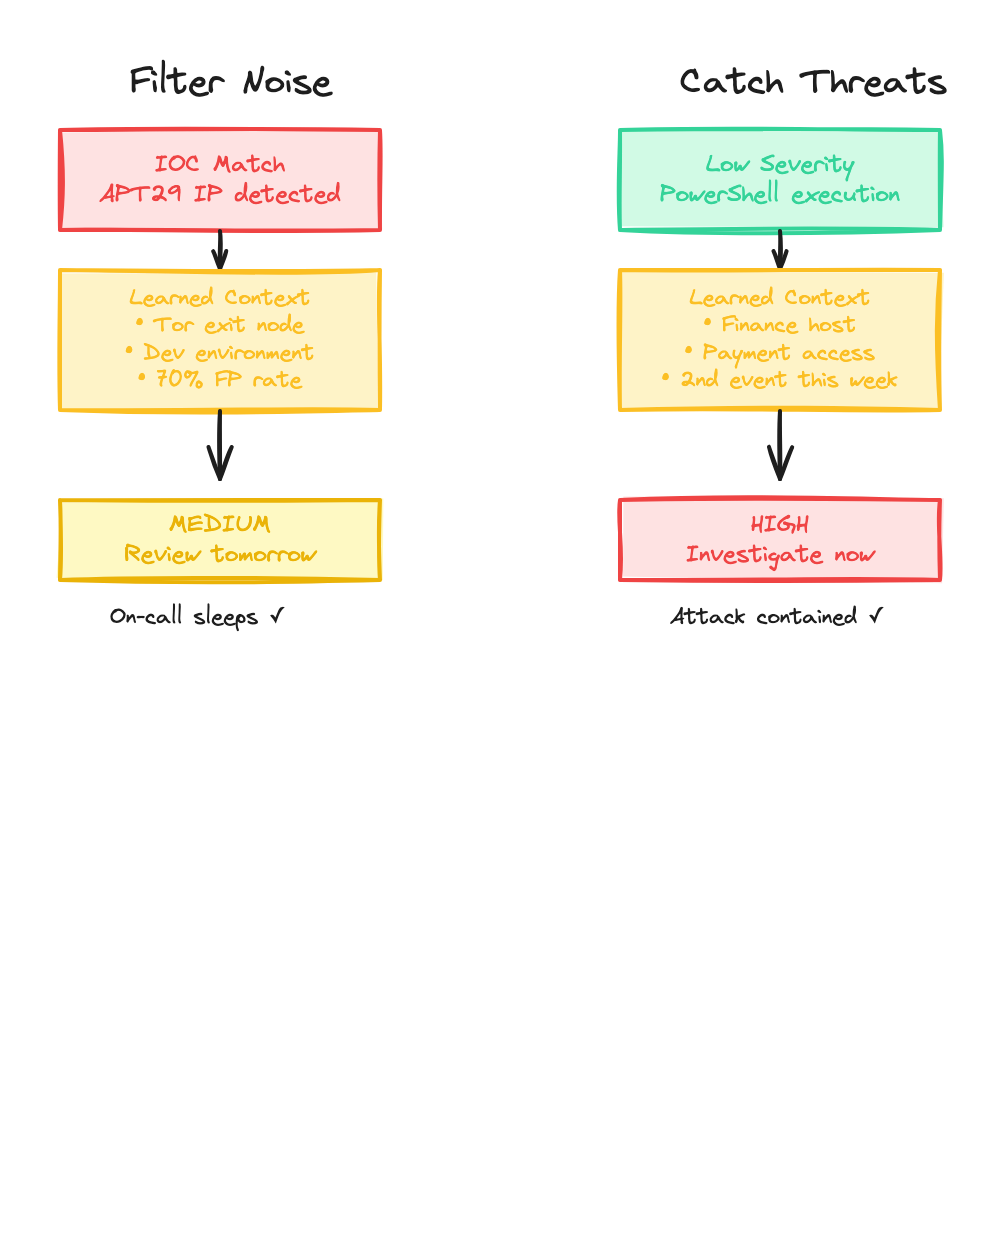
Alert fatigue: Your SIEM pages on-call at 3am for an IOC match. Two hours later, it’s confirmed as a Tor exit node hitting a dev server. Another false positive. Analysts start ignoring alerts.
Missed threats: A “low severity” PowerShell event sits at position #347 in the queue. Three days later, ransomware detonates. The subtle indicators were there—but buried in noise.
Traditional tools can’t solve this because they lack context and can’t learn. They treat every IOC match the same, regardless of what the target is, what the historical false positive rate is, or what your team has learned from past incidents.
How Intelligent Triage Works
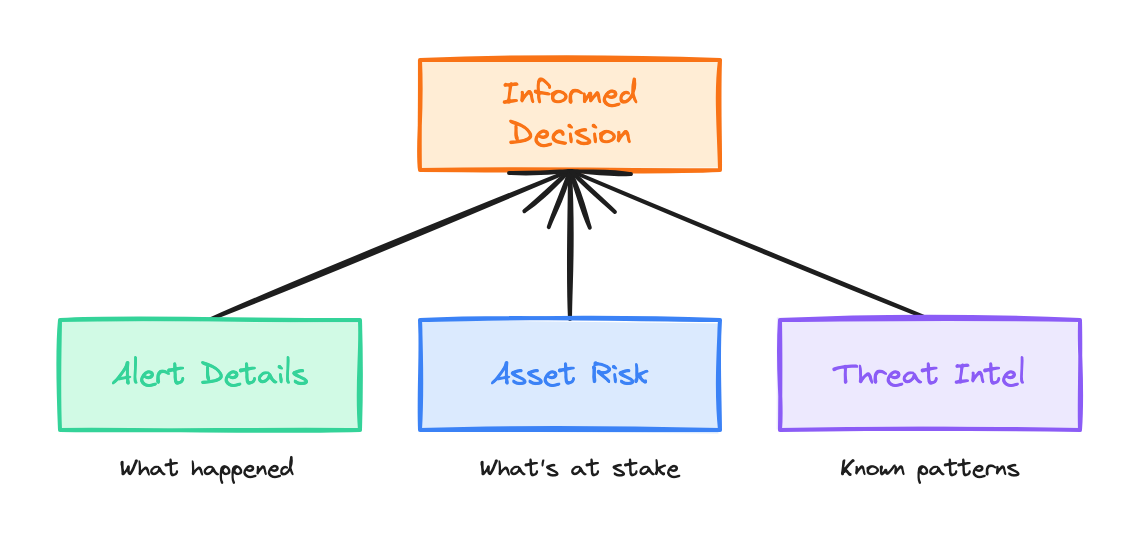
Section titled “How Intelligent Triage Works”The system combines three things traditional SIEMs lack:
-
Contextual awareness — The system knows not just that an alert fired, but what asset was targeted, how critical it is, who owns it, and what threat intelligence says about the indicators involved.
-
Learned judgment — Through analyst feedback, the system learns what your team considers noise vs. real threats. It internalizes your risk tolerance, attribution standards, and escalation preferences.
-
Continuous improvement — As analysts correct decisions, those corrections compound into systematic improvements. The system gets smarter over time, not just more rules.
What the System Learns
Section titled “What the System Learns”The same system handles both directions—reducing noise AND catching subtle threats—because it’s learned what your team actually cares about.
The Data Foundation
Section titled “The Data Foundation”Intelligent triage requires three categories of data, stored as structured tables in a dataset.
Security Events
Section titled “Security Events”Your SIEM, EDR, or detection systems feed events into an events table:
| event_id | timestamp | event_type | source_ip | dest_ip | dest_hostname | severity | raw_log |
|---|---|---|---|---|---|---|---|
| evt-001 | 2024-01-15T03:42:00Z | ssh_brute_force | 185.220.101.42 | 10.0.1.50 | dev-server-03 | HIGH | Failed SSH attempts… |
| evt-002 | 2024-01-15T09:15:00Z | powershell_anomaly | — | 10.0.2.100 | fin-admin-ws | LOW | Encoded PowerShell… |
| evt-003 | 2024-01-15T11:30:00Z | malware_callback | 10.0.3.25 | 91.234.56.78 | marketing-pc | CRITICAL | C2 beacon detected… |
Each row captures the raw detection with its original severity—before any contextual analysis.
Asset Inventory
Section titled “Asset Inventory”Your CMDB or asset management system populates an assets table:
| hostname | ip_address | environment | criticality | data_classification | owner | business_unit |
|---|---|---|---|---|---|---|
| dev-server-03 | 10.0.1.50 | development | low | internal | Platform Team | Engineering |
| fin-admin-ws | 10.0.2.100 | production | critical | pii, financial | J. Martinez | Finance |
| marketing-pc | 10.0.3.25 | production | medium | internal | S. Chen | Marketing |
When an alert fires, the system joins against this table to understand what’s actually at stake. A “HIGH” severity alert hitting a dev server is very different from the same alert hitting a finance workstation.
Threat Intelligence
Section titled “Threat Intelligence”Structured indicators populate an IOCs table:
| indicator | indicator_type | threat_actor | confidence | first_seen | tags |
|---|---|---|---|---|---|
| 185.220.101.42 | ipv4 | APT29 | medium | 2023-06-15 | tor_exit_node, cozy_bear |
| 91.234.56.78 | ipv4 | FIN7 | high | 2024-01-10 | carbanak, c2_server |
| encoded_ps_loader.ps1 | file_hash | Unknown | low | 2024-01-12 | powershell, obfuscated |
Beyond structured IOCs, unstructured threat intelligence—reports, TTPs, incident post-mortems—goes into a knowledge base for semantic search. When the system sees an APT29 indicator, it can retrieve context about that actor’s typical targets, techniques, and historical false positive patterns.
The Triage Pipeline
Section titled “The Triage Pipeline”The pipeline takes each security event and produces a structured triage decision. Here’s a simplified configuration:
name: security-event-triagehandler: language_model
inputs:  event:        # The raw security event  asset:        # Joined asset context  ioc_matches:  # Any matching threat intel  threat_context:  # Retrieved from knowledge base
outputs:  adjusted_severity: enum [CRITICAL, HIGH, MEDIUM, LOW, INFORMATIONAL]  confidence: number (0-100)  reasoning: string  recommended_action: enum [page_oncall, investigate_urgent, investigate_normal, log_only]  threat_assessment:    likely_threat_actor: string | null    attribution_confidence: enum [high, medium, low, none]    attack_stage: enum [reconnaissance, initial_access, execution, persistence, lateral_movement, exfiltration, unknown]
The system prompt instructs the model to weigh factors like asset criticality, IOC confidence, historical patterns, and threat actor TTPs—then produce a structured decision.
Walkthrough: Event evt-001
Section titled “Walkthrough: Event evt-001”Let’s trace how the SSH brute force event flows through:
1. Event arrives:
event_id: evt-001event_type: ssh_brute_forcesource_ip: 185.220.101.42dest_hostname: dev-server-03original_severity: HIGH2. Asset context joined:
environment: developmentcriticality: lowdata_classification: internal3. IOC matches found:
indicator: 185.220.101.42threat_actor: APT29confidence: mediumtags: [tor_exit_node, cozy_bear]4. Knowledge base retrieval:
“APT29 (Cozy Bear) typically targets government and diplomatic entities. IP 185.220.101.42 is a known Tor exit node used by multiple actors. Attribution to APT29 based solely on this IP should be considered low confidence…”
5. Triage decision:
adjusted_severity: MEDIUMconfidence: 85reasoning: | Downgraded from HIGH to MEDIUM. While the source IP matches APT29 threat intel, it's a known Tor exit node (attribution unreliable). Target is a development server with low criticality and no sensitive data. SSH brute force against dev infrastructure is common noise.recommended_action: investigate_normalthreat_assessment: likely_threat_actor: null # Can't attribute via Tor attribution_confidence: none attack_stage: reconnaissanceThe analyst reviews this in the morning, confirms the reasoning, and moves on in 10 minutes instead of a 3am wake-up.
Measuring Success
Section titled “Measuring Success”How do you know the system is improving? Track these metrics:
| Metric | What It Measures | Target |
|---|---|---|
| False positive rate | Alerts escalated that turned out to be noise | Decreasing over time |
| Mean time to triage | How long events sit before getting reviewed | Decreasing for high-priority |
| After-hours pages | 3am wake-ups for non-critical issues | Decreasing |
| Missed threat rate | Real incidents that weren’t escalated | Zero or near-zero |
Implementation
Section titled “Implementation”Building this system requires:
- Data integration — Connect your SIEM events, asset inventory, and threat intelligence feeds
- Knowledge base setup — Index your threat reports and IOC data for semantic search
- Pipeline configuration — Define the triage logic and output schema
Component Summary
Section titled “Component Summary”| Component | Role in Threat Triage |
|---|---|
| Dataset | Contains structured security data (events, IOCs, assets) |
| Tables | Schema-defined storage for events, indicators, and inventory |
| Files | Threat reports, runbooks, CVE bulletins |
| Knowledge Base | Semantic search over threat intel for contextual retrieval |
| Pipeline | Makes triage/notification decisions using LLM judgment |


